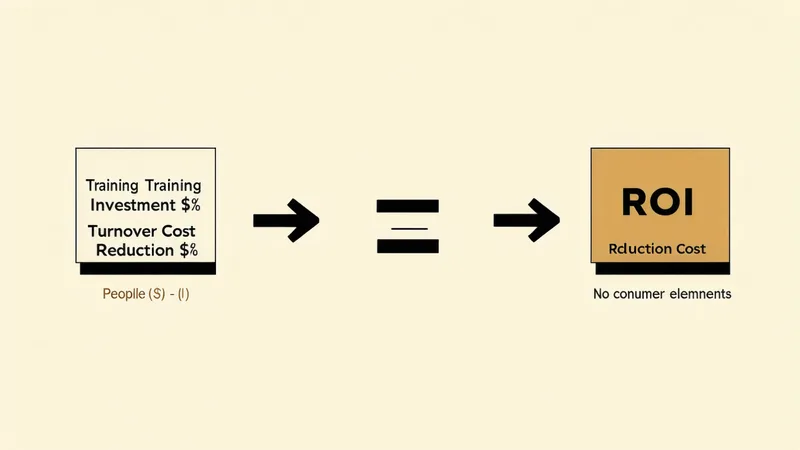
The Kirkpatrick Model has been the dominant framework for L&D evaluation since the 1950s. Level 4 — measuring business results — is the level every L&D function aspires to and almost none achieves consistently in an ops context. The problem isn't conceptual. The problem is data access: to demonstrate Level 4 outcomes, you need outcome data (productivity rates, quality metrics, incident rates, customer satisfaction) attributed to specific learning interventions — ideally with the granularity that xAPI statement records can provide when learning activity is properly instrumented — and controlled for other variables. At most operator organizations, the L&D function doesn't have access to that data in a form that's analyzable, and the IT and ops infrastructure required to get it exceeds the L&D budget and influence level available.
There's a simpler model that consistently gets CFO attention in ops organizations, and it doesn't require outcome data you can't access. It ties learning investment to turnover cost — a number the CFO already has or can easily construct, and a causal link that is directionally defensible without requiring controlled trial conditions.
Why Turnover Cost Is the Right L&D ROI Anchor for Ops Organizations
At an ops organization with 30–40% annual turnover on frontline roles, turnover cost is already on the CFO's radar. The CFO knows what it costs to recruit, onboard, and ramp a replacement for a role that turns over — and in most ops verticals, that number is material. Industry-realistic ranges for fully-loaded turnover cost (recruiting, temporary coverage, productivity loss during ramp, training administration) run from 0.5× to 1.5× annual salary depending on role complexity and labor market conditions. For a frontline ops role at $40,000–$55,000 annual salary, that's $20,000–$80,000 per turnover event.
The link between onboarding quality and first-year retention is directionally established in workforce management research, even if the specific numbers vary by context. Workers who complete structured onboarding programs that connect them to their role expectations and career path — rather than ad hoc orientation followed by sink-or-swim — show lower first-year attrition at rates that, in aggregate across a large operator workforce, represent meaningful cost reduction.
The ROI case for L&D investment in this framing: if a structured role-mapped onboarding and development program reduces first-year turnover by even a modest percentage — say, from 35% to 28% at a 1,500-person logistics operator — the absolute dollar value is calculable and substantial.
The Four-Step Calculation
The model Carlos Lau has described in conversations with ops L&D directors has four components, each of which uses numbers the organization already has or can reasonably estimate:
Step 1: Annual turnover volume. Take your current annualized turnover rate for the target roles (frontline ops, field tech, dispatch — wherever your learning program applies) applied to the headcount in those roles. A 1,500-person ops workforce at 30% turnover = 450 turnover events per year. This is usually available from HR.
Step 2: Per-event turnover cost. Use a conservative figure — 50–75% of the annual salary for the role. At $48,000 average annual salary, that's $24,000–$36,000 per event. If your CFO has already done a detailed turnover cost analysis, use that number. If not, start with the conservative end of the range. CFOs are more receptive to a calculation they consider conservative than to a number that seems inflated.
Step 3: The expected retention improvement. This is the honest hardest step, because you're projecting a causal relationship you haven't yet proven in your specific context. The approach: use a conservative, directionally credible improvement estimate — typically 5–10 percentage points on first-year retention for roles where the current onboarding is demonstrably poor (ad hoc, low-structure, high-variation by manager). Do not claim more than this without data from a comparable operator context to support it.
Step 4: The net value calculation. (Reduction in annual turnover events) × (per-event cost) minus (annual cost of the learning program). If the result is positive, you have an ROI case. The arithmetic for the scenario above: 450 current events × 30% first-year rate = 135 first-year turnovers. A 7-point improvement (30% → 23%) = 31.5 fewer first-year turnover events. At $28,000 per event = $882,000 gross annual value. Learning program cost at $40,000–$80,000 for an operator at this scale = net value of $800,000+.
What Makes This Model Defensible (and Where Its Limits Are)
The model is defensible because every number in it is either directly measured or conservatively estimated, and the CFO can stress-test any assumption. The causal claim — that a better onboarding program reduces first-year turnover — is not experimentally proven in your specific context, but it is directionally credible. You're not claiming credit for all retention improvement. You're claiming credit for the L&D-addressable portion of onboarding quality.
We're not saying this model is a substitute for rigorous program evaluation — it isn't. If you can eventually build the data infrastructure for Kirkpatrick Level 4 measurement, that's a stronger case. What we're saying is that waiting for Level 4 data before making an L&D investment case means never making the case. The turnover-anchor model is deployable now, with data you have now, and produces a number that finance teams find legible.
The limit to acknowledge explicitly: the model attributes the full retention improvement to the learning program, which overstates L&D's contribution. The honest framing with a CFO is: "The learning program is one contributing factor to retention. Our conservative estimate assumes it accounts for X percentage of the improvement observed in comparable operators. We're not claiming the full effect." That nuance — offered proactively, not extracted under questioning — actually builds credibility with a rigorous CFO.
Connecting the Calculation to a Measurement Commitment
A CFO-ready ROI case isn't a one-time presentation — it's a measurement commitment. If you're going to claim a 7-point retention improvement as the basis for a program investment, you need to track whether that improvement materializes, by cohort, over 12–18 months after rollout.
The measurement architecture: tag each new hire cohort at entry with their assigned learning path, track 90-day and 12-month retention by cohort, compare cohorts that completed the structured path versus those who received lighter or no onboarding (ideally using natural variation in rollout timing as a quasi-control). This isn't a controlled trial — confounders abound. But cohort-level retention data, broken down by onboarding completion, is the evidentiary floor for defending the ROI claim in a year-one review.
L&D teams that make the budget case without building the measurement commitment lose credibility in the second conversation. L&D teams that present the case, make the commitment to measure it, and then actually deliver the 12-month retention data — even if the numbers are messier than projected — gain influence within the finance and ops leadership teams in a way that learning outcome surveys and engagement scores never produce.
At Kurios, cohort-level completion and path progress data is tracked from day one of enrollment. Combined with the HR retention data your Workday instance already holds, the 12-month retrospective becomes a query, not a research project. Completion records for OSHA and DOT-required training carry regulatory standard attribution, so the same dataset that drives the ROI calculation also satisfies the audit trail requirement — one record layer serving two audiences.